University Assessment System
Evidence of Student Learning
Evidence of Student Learning
The University assessment system uses key program assessments to measure student mastery of the University, professional, and general education learning outcomes.
Reporting Schedule
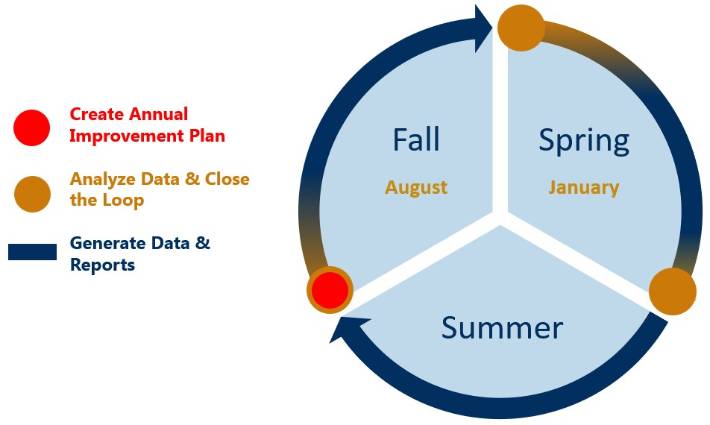
Key program assessment data reports are currently provided using spreadsheets and bar graphs biannually:
- Fall semester (December)
- Full academic year (May)
A new system will provide dashboards for data analysis at any time.
Reporting Scale
A numeric score ranging from 0.00 - 4.00 is generated using key program assessments. Students may receive a score of 4, 3, 2, 1, or 0 for each rubric criterion. Criterion scores are aggregated to create reports at different levels.
Reporting Levels
Click below to view examples of the data reports provided at various levels:
Reporting Level |
ORU Outcomes |
Professional Outcomes |
| University | Example | Not Applicable |
| College | Example | Example |
| Program | Example | Example |
| Assessment | Example | Example |
| Criterion Line | Example | Example |
Click below to view examples of program data reports:
 |
 |
 |
College of Arts & Cultural StudiesCommunication (B.A.)
|
Fenimore & Fisher College of BusinessManagement (B.S.)
|
College of EducationTeaching and Educational Leadership (M.Ed.) |
 |
 |
 |
College of Health SciencesNursing (B.S.N.)
|
College of Science & EngineeringEngineering (B.S.E.)
|
College of Theology & MinistryMinistry & Leadership (B.A.) |
Evidence of Student Learning
Assessment System Continuous Improvement
Recent Improvements
- Longitudinal data tables provided to program faculty
Next Steps
- Explore new tools for reporting data
- Create dynamic reporting dashboards that are viewed on the Continuous Improvement & Assessment SharePoint site

